
Tetsuya Fujita is best known for his tornado scale and research into thunderstorms and downbursts. He also did a lot of public outreach and has an IMDb page.
Many of his insights into severe weather came from studying damage patterns. This fascination with damage probably grew out of his early experiences during World War II.
The early years
Fujita was born in 1920 on northern Kyushu Island in the Greater Japanese Empire. His parents, both teachers, lived in a small village. As a child he loved exploring, as well as cartography.
His father died in 1939, two years after the Second Sino-Japanese War had begun. His mother died in 1941, the year that Japan attacked Pearl Harbor.
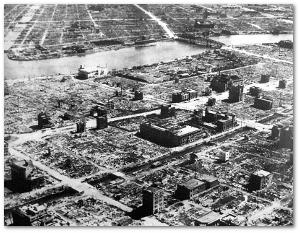
Ted recalls that the last words of his father actually saved his life. Ted wanted to attend Hiroshima College but his father insisted that he attend Meiji College on Kyushu Island. Had Ted attended Hiroshima College, Ted likely would have been killed by the first atomic bomb which exploded there in 1945. Shortly, after his fathers death, Ted received admission letters from both Hiroshima College and Meiji College. In honor of his fathers wishes, Ted selected Meiji College and majored in Mechanical Engineering. He also was interested in geology, specifically volcanoes and caves. For recreation, he was a spelunker. Ted also liked to draw maps and collected topographic maps of the local area. His interest in cartography clearly lasted into his professional career. World War II started to affect Ted’s life. He graduated six months earlier than anticipated and soon after was appointed as an assistant professor in physics. Ted taught elementary physics and physics lab. On a visit to Tokyo in March 1945, Ted witnessed a fire bomb attack by the Americans which burned 230,000 homes overnight. He heard a loud bang at close distance. The next day Ted found an unexploded bomb very near where he was staying.
On August 9, 1945 an atomic bomb was dropped on Nagasaki, about 135 miles away. Ted was later informed that the bomb was actually targeted for Kokura Terminal, about three miles from the college where Ted was staying. Ted recalled it was cloudy that day with thick stratus. Air raid sirens sounded as the bomber approached and Ted sought shelter in the bunker next to the Physics building. Evidently, the weather was not adequate over his town for dropping the bomb and the pilot flew off toward their second target Nagasaki. Ted no doubt would have been killed from the concussion of the blast. WWII ended six days after the dropping of the second atomic bomb. About a month later, Ted was asked to survey the bomb damage along with a group of students. From analyzing burn marks on certain objects, Ted was able to determine that both bombs were detonated at about 520 feet above the ground. Ted theorized the Americans new the pressure distribution above the cities in spite of the complete blackout of weather reports. Later, Ted found out dropsondes were deployed above the cities prior to bombs being released.
— Tim Marshall
What would your next professional step be after witnessing the firebombing of Tokyo, and later that year, calculating the detonation height of two atomic bombs, one of which went off just 75 miles (120 km) or so from your office?
Having seen the worst that man could do, and also having learned to think in three dimensions while mapping volcano craters during his student days at Meiji College, Tetsuya Fujita turned to nature. He got a grant in 1946 to reeducate grade school teachers on any science topic and chose weather, because it could be studied inexpensively.
With the help of a large number of his students and their friends and families, Fujita then collected and mapped daily weather data for a monthly booklet.
He also sent his volunteer army to 46 observation stations to take 15-minute weather observations during an eight-hour solar eclipse to document how it affected the wind and temperature.
In August 1947, he climbed up Seburiyama Mountain to observe a thunderstorm, recording complete data on its wind, temperature, and pressures. He also made time-lapse sketches of the storm’s height, winds, rain and lightning.
The result: He realized that storms suck up warm air at their leading edge and have cool downdrafts at the back.
Fujita published a paper on it that stirred absolutely no interest whatsoever. Later, though, he gave a presentation to the Fukuoka Weather Service District, where he had observed the thunderstorm.
Those field forecasters were impressed. More importantly for his future, a weather service employee gave him a copy of a research paper about thunderstorms by Horace Byers of the University of Chicago – it had been thrown out at the local US Air Force radar base.
Upon reading the paper, Fujita sensed that Byers also saw a thunderstorm in microanalytic terms. The young Japanese scientist then borrowed money to buy a typewriter and transcribed his research paper into English, using a one-finger typing technique. He mailed it to Byers in Chicago along with a request for his opinion and comments.
Horace Byers was the director of the US Thunderstorm Project (PDF) and was very impressed by the downdraft theory Fujita had made with only the most basic weather tools.
Now hooked on weather, Fujita went into the Tokyo University doctoral program in meteorology.
In 1948, as a student, he studied a rare “Dragon Swirl” – a waterspout that had come inland as a tornado at Enoura on Kyushu Island. The resulting sixty surface maps of 20-minute pressure, temperature and rainfall intervals were Ted Fujita’s first tornado damage survey.
In 1951, Byers wrote back to him, and the two men began exchanging letters and research papers.
As soon as Fujita, now married and with a young son, graduated in 1953, Byers invited him to the University of Chicago for a two-year visitation. Fujita spent the plane flight sketching clouds and plotting their timelines. Yes, he was a nerd.
Those two years were spent studying severe weather with a US Weather Bureau researcher. They came up with the concept of a mesocyclone – rotation within a thunderstorm – and they suggested that it was a key factor in tornado formation. As well as explaining what it was, Fujita used his impressive cartography to carefully diagram this new weather concept.
Today we have YouTube:
After the two years were up, Fujita had to return to Japan briefly to finish his teaching contract there. Then he returned to the US, this time with his wife and child. He also changed his first name to Theodore.
1957 – The photogenic Fargo tornadic supercell
On June 20, 1957, a “swirling cloud” (supercell mesocyclone) spawned five tornadoes, one of which hit Fargo, North Dakota, killing 10 people and injuring another 103. It happened during the “Instamatic” and home movie era, and a lot of people took pictures and video of the storm and the tornado. These ultimately ended up with Horace Byers and Ted Fujita.
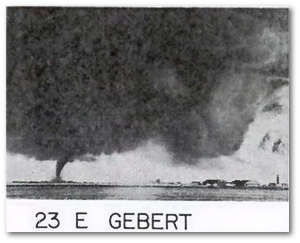
Over the next two years, using the same triangulation techniques that had given him the detonation height of the A-bomb that hit Nagasaki some 12 years earlier, Fujita invented tornado photogrammetry, and he concluded that “the tornadoes in the Fargo area did not occur by chance but were the product of well organized conditions very favorable for tornado formation.”
This was quite an improvement over the era when the Weather Bureau refused to allow tornado forecasts or warnings. Now researchers had something to work with.
The 1965 Palm Sunday tornado outbreak
On April 11-12, 1965, forty-seven tornadoes hit parts of Indiana, Ohio, Michigan, Wisconsin, Illinois and Iowa, killing 271 people and injuring 1,500 (1,200 of them in Indiana).
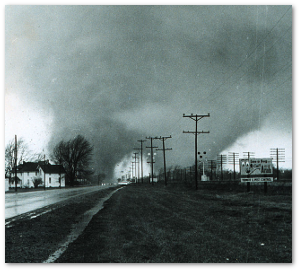
For the next four days, Ted Fujita studied (PDF) the areas of destruction, logging some 7,500 miles in a small Cessna. His detailed maps showed that tornadoes didn’t skip over the ground, as everyone believed. Instead, thunderstorms cycled through whole families of tornadoes, and sometimes the next tornado in the cycle would be bigger and stronger than the one that came before it.
He also noted “several spots of strong suction” and believed that they might be smaller twisters within the bigger tornado. It would take several more years before the existence of multivortex tornadoes and suction vortices was proven.
These vortices are the reason why one building can be completely destroyed during a tornado while a more fragile structure right next to it is hardly damaged.
The Fujita Scale
Everybody knew that tornadoes could be either strong or weak, but wind speed couldn’t be directly measured since they destroyed the instruments. Nuclear power plant builders needed to know what to plan for, so the Nuclear Regulatory Commission began funding Fujita, who developed a working relationship with Texas Tech’s Wind Science and Engineering (WISE) Research Center after investigating a Lubbock, Texas, tornado in 1970.
After a tornado, Fujita would study the damage path from an airplane. Engineers from WISE would do a ground survey along the same path.
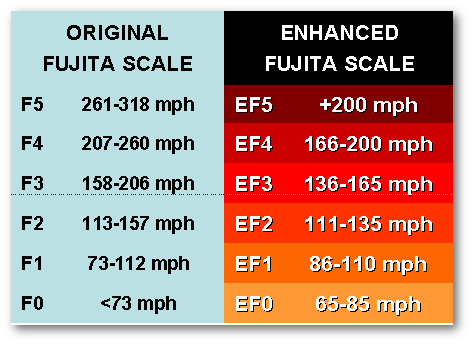
In 1971, Fujita used the upper end of the Beaufort Wind Scale and the lower parts of the Mach scale to devise a six-point (0-5) range of wind speeds from about 40 up to 319 mph, based on the damage they caused and the type of structure involved:
- F0 (Gale)
- F1 (Weak)
- F2 (Strong)
- F3 (Severe)
- F4 (Devastating)
- F5 (Incredible)
In 2007, US meteorologists revised the Fujita Scale slightly. This is why forecasters now give an E[xtended]F[ujita] number for a tornado instead of just an F number.
Legacy
Ted Fujita accomplished so much before his death in 1998, it is impossible to just write a little bit about him.
Besides his work on tornadoes, Fujita’s legacy includes seminal work on mesoscale analysis, severe weather and downbursts.
I haven’t even talked about his and Byers’ discovery of downbursts and microbursts, and can only mention here that it has saved the lives of many air travelers.
Nor how he was the first to make moving pictures out of satellite images – he made the first movie of Planet Earth.
He also pioneered the technique of sending out a group of trained people to track weather.
Where would we be without him?
As Poyekhali919 puts it, Arigato, Fujita-sensei! Thank you, Teacher Fujita!
Sources:
Tim Marshall. A Tribute to Dr. Ted Fujita. http://www.Stormtrack.org.
Nancy Mathis. Storm Warning: The Story of a Killer Tornado. Touchstone, 2007.
James R. McDonald. T. Theodore Fujita: His Contribution to Tornado Knowledge through Damage Documentation and the Fujita Scale. (PDF) American Meteorological Society. 2001.
Mike Smith. Warnings: The True Story of How Science Tamed the Weather. Greenleaf Book Group Press, 2010.
Tetsuya ‘Ted’ Fujita, 1920-1998. University of Chicago News Office. November 20, 1998.
Ted Fujita. Presentation at the Third Tornado Symposium, Norman, Oklahoma, April 1991.
