

Krakatoa, which is actually west of Java, gave us clues about how a large eruption in the tropics affects the Earth.
A hundred and eight years later, so did Mount Pinatubo in the Philippines — and at that point, we had the technology and know-how to do even better science on it.
Further along in the satellite era, Hunga Tonga-Hunga Ha’apai punched the sky in 2022, showing everyone how a monster eruption could change things in Earth’s upper atmosphere (and as a result, possibly influence global climate).
But do clues like these tell us what Toba’s most recent supereruption might have done to the planet and how another such cataclysm today would affect us?
Up to a point, yes, these clues are helpful.
However, beyond that point are major uncertainties that need to be clarified as much as possible before the next VEI 8 occurs somewhere in the world.
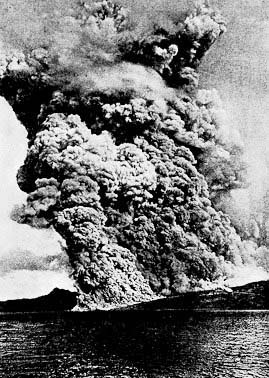
Krakatoa, August 26-27, 1883
In a sense, modern volcanology began in 1886 with the British Royal Society’s committee report on Krakatoa. (Schaller et al.)
The eruption of another Indonesian volcano — Tambora — in 1815 had been stronger than Krakatoa’s 1883 blast, with more intense global effects.
But Krakatoa blew itself up at a time when reliable submarine cable networks were making rapid intercontinental information sharing by telegraph possible, and even routine. (Winchester)
This made all the difference.
- The detailed information that scientists needed was out there. Besides formal logs kept by civilian and military fleets (including ships that were in or near the Sunda Strait when Krakatoa erupted and eventually exploded there), many Westerners at home or stationed in colonies around the world were busy journalling, and quite a few of them had barometers and other gadgets to record local weather and other conditions.
- Widespread public interest in Krakatoa and volcanism was generated by what was the first real-time news coverage of a major natural disaster. (Winchester)
- Global communication gave the Krakatoa Committee almost immediate access to all of that data, instead of their having to wait for it to come trickling in haphazardly by word of mouth, post, courier, and sea-going vessel over months to years. The result: a timely and amazingly detailed report that is still referenced in volcanology papers.
Of course, no technology was needed for many people in the Victorian era to see the most impressive global effect of Krakatoa’s explosion — all they had to do was look up.
Fortunately for us in the future, a London artist recorded what he saw in almost photographic detail.
William Ascroft actually did time-lapse sketches to capture afterglow changes as night came on! The Krakatoa Committee saved each and every one but only included three in their report.
Now Getty Images seems to have the copyright, but you can see thumbnails of 29 of Mr. Ascroft’s images here.
Why those colors occurred was a subject of intense debate in the 1880s.
Volcanoes and climate
Among proposed causes for the fiery skies was sulfuric acid, blown sky-high by Krakatoa and reflecting incoming sunlight in various ways, but this suggestion, although very close to what we now know for sure happens, went nowhere and the idea was dropped until the 1970s. (Schaller et al)
That’s when scientists noticed that cooler summers in the Northern Hemisphere have often followed large explosive eruptions occurring in various parts of the world over the last thousand years. (Oppenheimer; Williams)
This discovery got discussions going again on possible climate effects of volcanic gases that do get blown sky-high.
The main gaseous offender not surprisingly turns out to be sulfur, typically as sulfur dioxide or hydrogen sulfide (Oppenheimer), which reacts with what little water there is in the stratosphere — a freeze-dried layer of Earth’s atmosphere (Khaykin et al.) whose existence was unsuspected in the 1880s, although the Krakatoa Committee did speculate about high-altitude winds, per Schaller et al.
The chemical reaction between that volatile sulfur and H2O results in suspended droplets of — yes — sulfuric acid in the stratosphere’s thin air.
It looks like this:

On August 8, 1991, astronauts aboard the shuttle Atlantis photographed this double layer of sulfate aerosol from the eruption of Mount Pinatubo. It’s located twelve to fifteen miles (20-25 km) above Central Africa: the dark things at the bottom are thunderstorm cloud tops. (Image: NASA, public domain; description from Oppenheimer)
This sulfate aerosol makes physics happen (Evan et al.; Marshall et al.; Oppenheimer):
- The aerosol layer, which lasts for more than a year, reflects some incoming sunlight away from the planet.
This has a cooling effect on land and sea, but don’t go automatically linking it to those chilly post-eruption Northern Hemisphere summers just yet. Earth processes are never simple, and even supercomputers have a hard time modeling this!
- Sulfate aerosols also absorb certain types of infrared radiation coming off the planet’s sun-heated surface.
This has a warming effect on the stratosphere, which is usually quite cold at the bottom level, closest to Earth and within reach of big eruptions.
- Physics 101 tells us that warm air rises and cool air sinks, so temperature changes affect the winds up in the stratosphere and also down here in the troposphere, where weather happens.
Speaking of weather, meteorologists tell us that warm air holds more water vapor than cool air does. Temperature changes, then, can also affect patterns of precipitation. Basically, in many places when Earth cools, less rain and/or snow falls.
The gigantic Youngest Toba Tuff supereruption aside, imagine the intricate cascade of effects that just this simple volcano-induced cooling and heating sets off in a system as complex as Earth’s climate! (Marshall et al.)
Now supersize it. Mind. Boggled.
In terms of regular volcanism, you and I have the benefit of hindsight for all this sulfurous insight, but back in the 1970s and 1980s all that anyone could do was imagine it.
They had a very good general idea of how volcanic sulfur emissions might affect climate, but no data existed on key things like the sulfate aerosol’s distribution after a big eruption or what the optical properties of those high-flying sulfate droplets might be — just how much sunlight would they reflect, anyway? (Oppenheimer)
Science’s knowledge gap on supereruptions is even bigger, but back then volcanologists weren’t doing much thinking about such rare and mysterious events.
Their questions about volcanic sulfates were more practical, especially in light of other studies during the 1980s and beyond about potential stratospheric effects of a major nuclear exchange.
Theorizing and nothing but theorizing went on until 1991, when a big eruption happened and satellites, high-altitude balloons/research planes, lidar, and modern weather station technology recorded the results (Oppenheimer) in volume and detail that would have made Krakatoa Committee members green with envy!
The vast quantity of measurements from a variety of ground, air, and space-based sources both provided data to initialize realistic computer models AND also gave a real-world check on the output of those models. (Oppenheimer)
That’s called having your cake and eating it, too!
Marshall et al. call it the benchmark against which all other eruptions are measured today.
Yes, even supereruptions.
Pinatubo, June 15, 1991
No one suspected that one of the scenic mountains north of Manila, capital of the Philippines, was an active volcano until early April 1991, when it had a brief series of small steam explosions.
Filipino volcanologists set up some seismic stations in the area and were surprised at how many earthquakes were happening there.
Obviously, trouble was brewing.
With assistance from US volcanologists, an observatory was quickly established on nearby Clark Air Base, and the scientists recorded every step in Pinatubo’s return to life.
One of the first pictures of a pyroclastc flow also nicely captures the buoyant coignimbrite plume rising above that flowing hot debris. (Image: Angelo Helperin via Wikimedia, public domain)
This culminated on June 15, 1991, in a VEI 6 eruption powerful enough to generate atmospheric shock waves that were detected as far away as Japan, as well as enormous pyroclastic flows locally whose co-ignimbrite clouds reached the stratosphere along with Pinatubo’s plinian/ultraplinian central plume and umbrella cloud. (Oppenheimer)
(A little foreshadowing here, from all sources: Due to the vast size of a supereruption — at least 5,800 km3 of magma for the Youngest Toba Tuff — and also because no one has ever observed one in recorded history, it’s difficult to reliably model a supereruption’s main plume[s] and possible contributions from co-ignimbrite clouds that rise above massive pyroclastic flows that are ranging over thousands of square miles; this, in turn, affects estimates of precisely how much of the supervolcano’s sulfur actually reaches the stratosphere , which matters a lot in terms of understanding the resulting impacts on global climate.)

Mount Pinatubo, June 1991. Pyroclastic flows like these didn’t quite make it to Clark, but ashfall from Mount Pinatubo heavily damaged the base, which the US abandoned. (Image: NOAA via Wikimedia, public domain).
Pinatubo and climate
The eruption of Mount Pinatubo is a dramatic real-life story in many ways, but let’s focus on its climate effects. These are what everyone now knows can happen.
To save space, I’ll just paraphrase a single source — Dr. Clive Oppenheimer’s Eruptions That Shook The World, which first helped me see how Pinatubo affected the world — leaving out equations and other technical details (but do check this excellent book out, if you’re curious; also, a host of other resources on Mount Pinatubo’s 1991 eruption and its effects can be found online at Google Scholar, Deep Dive, and similar sites, but these, unlike the Oppenheimer book, likely will be very technical).
Here’s a quote to get us started (and to show us processes that can happen to some extent in all big eruptions, including that of the Youngest Toba Tuff):
Several satellites mapped the initial spread of [Pinatubo’s huge umbrella] cloud around the tropics and its gradual expansion to high latitudes in both hemispheres. Weather satellites tracked the cloud for two days, beyond which it became too dilute (from spreading and sedimentation of ash) to discern. Another spaceborne instrument, the Total Ozone Mapping Spectrometer (TOMS), picked up on the continuing dispersal of the plume (Figure 3.3) . Although TOMS was designed to measure ozone abundance in the stratosphere, it proved to be very effective at detecting large volcanic sulphur dioxide (SO2) clouds thanks to its combination of ultraviolet channels. Combined with data from additional ultraviolet and microwave satellite sensing instruments [20], the best estimate for the total mass of sulphur dioxide released into the stratosphere by the 15 June 1991 eruption of Pinatubo is an astonishing 18 megatonnes.
(Even more astonishing are the sulfur estimates of 200 to 2,000 megatonnes that Black et al. use for their model runs on the Youngest Toba Tuff, 74,000 years ago — “super” is more than just a word!)
Instead of the book’s Figure 3.3, here is a video retrieved by Dr. Sergey Osipov from some of the initial TOMS data:
That SO2 cloud disappears, but not the sulfur! Chemical reactions in the stratosphere are converting it into as much as 30 megatonnes of tiny sulfuric acid droplets that will take about three years to settle out. (Oppenheimer)
That’s 1990s tech. Today’s animations of Pinatubo data look better, whether they are strictly utilitarian —
— strangely attractive —
— or somewhere in between:
In plain English, following Oppenheimer, the stratospheric cloud of sulfuric acid droplets took twenty-two days to travel around the world.
Most of it stayed in middle latitudes until jet stream changes, as the Northern Hemisphere’s winter came on, helped to spread the stratospheric sulfate cloud poleward.
When it was at peak thickness, in August and September 1991, this aerosol made the atmosphere very murky.
Again. (Image: NASA, public domain; description from Oppenheimer)
That cloud of sulfuric acid droplets also proved to be quite efficient at reflecting sunlight.
The ERBE (Earth Radiation Budget Experiment) satellite showed that the planet’s albedo was up five percent by August 1991.
Although this wasn’t uniform across the globe, incoming direct sunlight did drop by up to thirty percent, per Oppenheimer.
Fortunately, reflecting sunlight travels in all directions, so the sky also contained more diffuse light, which compensated somewhat for direct losses.
If you were around back then and not immediately affected by the eruption, did you notice changes in daylight?
I didn’t, in upstate New York.
Here’s something we all would have noticed, though: experts have estimated global light levels after the Youngest Toba Tuff supereruption as somewhere between the light of an overcast day and slightly brighter than the full moon. (Williams)
At noon.
Are they right?
No one can be sure, and unfortunately (but not for him), William Ascroft was not yet available to sketch it for us.
Getting back to Pinatubo’s benchmark effects during the early 1990s, particle sizes in the sulfate aerosol cloud were too small to allow global warming to overcome cooling.
By August 1991, as incoming sunlight bounced off Pinatubo’s “shiny” sulfur cloud, Earth lost heat between 40° N and 40° S at a rate of change twice that of any other month, according to Oppenheimer.
Many other factors were involved, too, including El Niño.
These complicated the big picture, just as they do nowadays whenever scientists try to reconstruct the Youngest Toba Tuff eruption, but eventually a globally averaged temperature drop of around 0.5° C from Pinatubo was evident by June 1992.
More specifically, while the aerosol was present in significant quantities (for about two years), Oppenheimer notes, summers were cooler — especially in central continental areas away from the ocean.
Winters were warmer in Scandinavia, Siberia, and central North America over that period, too.
In case you’re wondering about Krakatoa, Schaller et al. re-created some basic global atmospheric condtions for the relevant nineteenth-century time, which they say were similar to those in place when Pinatubo went off, and the researchers crunched the numbers.
In their modeling, the winter of 1884 is warmer in Europe, although North America experiences low temperatures.
Global cooling after Mount Pinatubo’s June 1991 eruption affected the planet’s precipitation patterns.
For a year afterwards, per Oppenheimer, globally averaged rainfall amounts over land decreased, but there were impressive regional variations.
The US had one of its wettest and coldest twentieth-century summers in 1992, while drought struck parts of Europe and almost all of sub-Saharan Africa.
Now, before we take all of this and try to apply it to Toba, there is one more big eruption to mention, and you can thank Osipov et al. for that.
They speculate about a Toba ultraviolet catastrophe — while freely admitting that none of it can be proven!
A major drop in ozone would allow much more solar ultraviolet radiation to reach us down here on Earth’s surface, causing both short-term effects like sunburn and eye problems and long-term things like increased rates of cancer.
This layperson is impressed by a possible connection between ozone depletion and another suggestion, mentioned later in this post, that any Toba-related extinctions occurred in open-forest habitats, not in rainforests, where mammals seem to have found a shelter even though these locations were a little closer to the Toba vent.
Was dense vegetation their refuge from a temporary UV storm after a superuption-related drop in stratospheric ozone?
It’s too early to say, but at least in passing we should get a little — just a little — better acquainted with UV-blocking ozone and the stratosphere where it hangs out.
The next eruption’s plume went there and even farther, interacting with ozone all the way.
Besides, a brief and superficial look at this very complex eruption gives us the opportunity to revisit some of the most amazing eruption footage of all time.
Hunga Tonga-Hunga Ha’apai, January 15, 2022
This is cool —
The day before, and some very brave Tongan geologists.
This is even cooler —
Would a supereruption look like that?
Probably not exactly like that unless it happened on the seafloor, as Kikai’s did.
A lot of that plume is vaporized Pacific Ocean, and the discussion of magma-water interactions and whatever else enabled Hunga Tonga-Hunga Ha’apai to shotgun- blast the top of Earth’s atmosphere from the bottom of the sea is ongoing and quite technical.
For land supereruptions like the Toba Youngest Tuff, explosive power probably comes from the same process that sets off “ordinary” plinian eruptions like Calbuco’s — a sudden and ongoing phase shift of dissolved gases out of magma and into bubbles that turn the molten rock into foam and vent it at insane velocities (Lowenstern et al.):
There’s nothing unusual about a supervolcano’s magma — what’s exceptional is the volume of the stuff, per multiple sources.
Of course, this powerful gas exsolution was going on at Hunga Tonga, too, so pumice (hardened rock foam), ash, and gases are also on their way up to the stratosphere and beyond in that famous blast video, along with the seawater. (Khaykin et al.; Sun et al.)
The relatively heavy stuff — pumice and ash — will soon fall back to Earth, but not the water vapor, which is going to be up there for a while, gradually decreasing until the early 2030s. (Fleming et al.; Khaykin et al.)
That huge quantity of water makes this eruption a special case, as does the extreme altitude of injection.
Besides making a very fine sulfate aerosol, the water also speeded up the ozone destruction that often occurs after volcanoes blow sulfur gases into the stratosphere.
Ozone is simply O3 and it accumulates in the stratosphere as certain wavelengths of solar UV radiation split atmospheric oxygen molecules apart. Some of the singletons team up with regular oxygen molecules to form ozone, which is really good at absorbing harmful UV-B radiation.
The absorbed solar radiation breaks ozone down into O2, which then gets knocked apart by those UV wavelengths again; more ozone forms; repeat the cycle often enough and pretty soon you’ve got a stratospheric ozone layer shielding life on Earth from old Sol’s nasty UV-B rays.
Chemical substances can break ozone down, too, including chlorofluorocarbons in spray products which were banned in the l980s after it was found that they made their way up to the stratosphere and were able to react with ozone on stratospheric clouds that form mostly over Antarctica, causing the infamous ozone hole.
These reactions need to happen on a surface like the one that polar stratospheric clouds, as well as both sulfate aerosol particles and water vapor, provide. (Sun et al.)
So more ozone-destroying reactions occur after some eruptions while the ozone-building ones carry on at the same pace.
Pinatubo, for example, reduced the ozone layer 6% below average in the Northern Hemisphere by April 1993, but regional variations, as usual, were noted.
Ozone was 10% below average over the US (Evan et al.; Oppenheimer) — by no means lethal, but that does raise the question of how low it can go.
We don’t know that yet, but the eruption of Hunga Tonga-Hunga Ha’apai showed us how fast it can happen. (Evan et al.)
Plenty of instrumental observations were possible, including high-altitude balloon flights downwind of the plume immediately after the eruption. (Evan et al.)

Figure 4, Sun et al., CC BY-NC-ND 4.0
Those balloon observations showed an ozone drop of 5% over the tropical Pacific and Indian Ocean in just a week — much faster than usual after an eruption, probably because of the plume’s high water content. (Evan et al.; Khaykin et al.)
What about the protective ozone layer?
Well, three years have passed and we’re still here.
It’s hard to say what the long-terms effects of that eruption are.
Fleming et al. did some NASA-level modeling and describe in rather technical terms the complicated and varied interactions between Hunga Tonga’s water and the stratosphere’s ozone.
In the parts of the paper that I can understand, they report finding a relatively small drop in global ozone, just 2% to 10%, in the upper stratosphere; a slight increase in middle stratospheric ozone; and some increase of the Antarctic ozone hole in the lower stratosphere.
It’s clear, though, that even well-observed volcanic effects on the stratosphere, and through that, on global climate are intricate and extensive. (Sun et al.)
Too, the Hunga Tonga-Hunga Ha’apai eruption was very unusual. Volcanologists are still hard at work, not always in agreement yet as they try to understand what exactly happened there and how it continues to affect our planet.
Only now, at this level of conjecture and theoretical modelling about an extremely well-observed eruption, are we ready to take a look at how a never-observed phenomenon — one that will probably happen again someday — might have affected the Earth.
Let’s tackle this in two stages:
- What the Toba supereruption was like
- How it might have affected our planet
Toba: Imagining the Unimaginable
“Imagining the Unimaginable” is part of the title Donovan and Oppenheimer use on their 2018 chapter about possible ways that a supereruption might affect our global civilization.
A supereruption of any size is unimaginable both because of its scale, beyond anything in our modern experience, and also because of the unpredictability of its effects on Earth’s complex systems (which, in turn, would affect us in many ways).
What was the Toba supereruption like?
We are very much at the “theorizing and theorizing” stage with this and other biggies.
Without any of the usual direct volcano observations available to us today — plume height, eruption duration, gas emissions, and various data on ash fall and pyroclastic flows (Cashman and Sparks; Crick et al.; Oppenheimer) — we can’t simply assume that Toba was a Krakatoa/Pinatubo/Hunga Tonga on steroids.
This, despite the big hole it left in northern Sumatra and its widespread ashfall that volcanologists have identified from the South China Sea to India and southward down to what’s now Tanzania, in Africa.
No doubt the enormous Youngest Toba Tuff eruption, about 74,000 years ago, was something along the lines of Krakatoa, Pinatubo, and Hunga Tonga-Hunga Ha’apai, but as mentioned, the devil is in the details.
Just. So. Many. Details.
Take plume height, for instance. What could be more straightforward than the idea that, when a geologic bomb went off and left that 62 x 19-mile-wide crater, over a mile deep, in Sumatra, it must have launched an eruption plume that reached the ionosphere, as Hunga Tonga’s did in 2022?
This is a perfectly reasonable notion, and most of us can imagine a Toba supereruption like that.
But have you ever seen a caldera collapse?
Madam Pele, out in Hawaii, shows us how it’s done:
Basically, caldera formation is a tectonic event. (Wilson et al.)
That observed 2018 summit caldera collapse at Kilauea wasn’t explosive, but it happened for the same reason that was behind big-booming Toba’s caldera collapse: all of the magma in the chamber below drained out and the chamber’s roof caved in. (Cashman and Sparks; Chesner; Mucek et al.; Wilson et al.)
Toba’s chamber was bigger by far, and so it had a much bigger collapse.
It’s the volcanism associated with each of these calderas that’s so very different.
At the Hawaiian volcano, 0.8 km3 of runny basaltic magma flowed out of the summit chamber underground, down and then out of Kilauea’s East Rift.
At Indonesia’s Toba, at least 5,300 km3 of sticky, explosive magma came out of the ground, shattered into silicic ash, glass, and pumice, and headed for China, India, Africa, and points in between on land, sea, and air.
Somehow.
That’s a big difference!
At this point with Toba, a blizzard of problematical details hits researchers, who must accurately explain them if they want to know what that supereruption was really like.
For instance, just how do you brew up that large a quantity of magma at shallow levels in the first place, how do you keep it molten in Earth’s chilly upper crust for hundreds of millennia, and then how do you get it out of the ground and up into the air using the same physics that rules regular eruptions? (Cashman and Sparks; Deligne et al.; Gelman et al.; Giordano and Caricchi; Jellinek and De Paolo; Lowenstern et al.; Mastin et al.; Miller and Wark; Oppenheimer; Salisbury et al.; Sulpizio et al.; Wilson et al.)
Answer: (Crickets chirping).
Welcome to the wonderful world of supervolcano theorizing —
— on plume height:
- LaMEVE database: 42 km (Deep Thought/D. Adams)
- 20-30 km (12-19 miles) to as much as 50-80 km (31-50 miles) (Costa et al.; Williams, 2011)
- Low, highly concentrated fountains (Salisbury et al.; Sulpizio et al.)
— getting it out of the ground (mass eruption rate and duration):
- Shocking/Hours (Costa et al.)
- Intense/Days to weeks (Jellinek and De Paolo; Self, 2006)
- Impressive/Days or weeks to months or decades (Guballa et al.; Wilson et al.)
- Episodic/Thousands of years (Caron et al).
— and spreading that ash over more than 1% of the planet’s surface (Mason et al.):
- Unusual dynamics of the main and coignimbrite plumes (Oppenheimer)
- The jet stream (Williams, 2011)
- Umbrella cloud gravity current (Costa et al.)
We’re not going to go there, of course. This is the stuff that PhD theses are built on.
Instead, we’re going to move on to another big question about the Toba supereruption.
How did Toba affect climate?
Volcanic winter! Ice Age! Ozone catastrophe!
All of these could cause extinctions and genetic bottlenecks in plants, animals, and people, and all have been proposed, by one team or another, as climate effects of the world’s biggest supereruption during the last 2 million years.
But the geological and archaeological record doesn’t always back them up.
- The Youngest Toba Tuff supereruption occurred as Earth was moving from a warm period like ours (MIS5) into a glacial period (MIS4). (Caron et al.; Rampino and Ambrose)
This timing originally raised the possibility that cooling from Toba’s dense sulfate aerosol veil might have tipped the planet into an ice age.
That doesn’t seem impossible for a mega-colossal event. (I do need a thesaurus for these Toba-sized adjectives, but “mega-colossal” is the official word for a VEI 8 eruption; for perspective, there is no 9 on the VEI scale but the Youngest Toba Tuff gets a magnitude 9.1 from LaMEVE — it was supersized even among giants!)
As for speculation about a “Toba ice age,” well, there are many factors involved with glacial cycles. These aren’t as dramatic as a supereruption, but they change climate over geologic time just as effectively as raindrops that can and do wash away the mountains.
Current thinking is that global cooling was underway before Toba’s big blast — at most, per the present consensus, its supereruption might have enhanced the oncoming chill. (Caron et al.; Oppenheimer)
- Regarding biological effects, Oppenheimer notes:
…it appears that in Sumatra itself, the orangutan survived Toba, along with macaques, gibbons and the Asian tapir. In fact, there were no apparent extinctions on Toba’s home territory. Nor were any extinctions evident in another study of the fauna of the Mentawi islands, located off the west coast of Sumatra and just 350 kilometres from Toba. Significantly, all these animals live in rainforest habitats suggesting that whatever impacts the Toba eruption had on the ecosystems of Sumatra, mammal populations found refuges in which to survive…The few species for which there is some evidence of extinction lived in open-forest habitats – in southern China, a species of elephant, and one of rhinoceros disappeared from the record, as did a pig and an elephant from Vietnam, and another pig, a bear, an ape and a couple of monkeys from Java. The extinguished species may have been in long-term decline before the eruption, which merely provided the coup de grace.
Of note, a severe bottleneck in the genome of modern tigers, who also inhabited those open Asian forests, has been dated to around Toba time. (Luo et al.)
- Speaking of bottlenecks, as we saw last time, not only are there no bottlenecks in human genetics now dated to Toba, but also lake sediment cores near Olduvai Gorge show no severe climate changes then, other than some drought (Guballa et al.), in this area where humans were thriving.
Closer to the vent, our little cousin Homo floriensis (the “hobbit”) lived on Flores Island — about as far from Toba as Utah’s Salt Lake City is from New York City — and made it through the supereruption and another 57,000 years before finally going extinct. (Oppenheimer)
- For all its undeniable humungousness, the Youngest Toba Tuff eruption apparently didn’t emit supersized amounts of sulfur dioxide.
Okay, that last point needs a little explaining.
Volcanic sulfur emissions that reach the stratosphere have major effects.
Think of Pinatubo and all the climate-changing sulfur aerosols detected by ground- and air- or space-based instruments after the Philippine volcano’s June 1991 eruption.
Because of all that new data, scientific understanding of how volcanoes influence Earth’s climate took a huge leap forward.
What about eruptions that occurred before the instrumental age of volcano science began in the mid-twentieth century? (Pyle)
The meticulous information-collecting approach pioneered by Britain’s Krakatoa Committee was the exception, not the rule, in the late nineteenth century.
Volcanologists can use letters, diaries, and other private or public documents to assess eruptions. This covers the last two thousand years or so, but these records are often difficult to interpret and unreliable. (Deligne et al.)
For prehistoric events, and even now still, when there is an unobserved eruption at some remote volcano, they have to play Sherlock Holmes and make inferences about pieces of evidence they find lying around at the scene of the crime eruption site.
How they do this is very clever, and what they find is fascinating for nerds and specialists, but it’s all way more technical than we want to get into here. Oppenheimer, Cashman and Sparks, and Wilson et al. all discuss it a bit, if you are curious.
Suffice to say that these inferences are sometimes quite detailed and are always useful when they can be validated by experiments. (Sulpizio et al.)
Sulpizio et al. have done experiments to check ideas about ordinary pyroclastic flows, but no one can scale-model a supereruption to validate ideas about how it would affect a whole planet.
Instead, the boffins turn to numbers and supercomputers.
Now, any computer model is only as good as the data and assumptions that go into it. (Bachmann and Huber)
This is the tricky part that adds error bars to any model output. (Cashman and Sparks; Marshall et al.; Oppenheimer)
Data on supereruptions are not plentiful, given the time intervals involved and the effects of weathering, erosion, and burial of superuption products through geologic processes.
To give you some idea of how that works in the tropics, in just a few years about 60% of Mount Pinatubo’s pyroclastic deposits washed away! (Self, 2006)
This, too, would happen after a superuption but on a much wider scale and for decades to centuries to come.
Volcanologists from the future who just study eruption deposits will have a hard time understanding how big Pinatubo’s 1991 eruption really was!
Assumptions about supereruptions are, at best, uncertain and will remain so until the next one happens.
But we need to know now what a supereruption might do to us — forewarned, even a little bit, is forearmed.
Which brings us, at the present state of supereruption knowledge, to Black et al., who have done one of the most in-depth and well-cited modeling studies of the Youngest Toba Tuff eruption’s climate effects that this layperson could find.
A model of Toba’s climate effects
In 2021, Black et al. published a paper on possible climate effects of the Toba supereruption.
Their model is not the only one out there, but it does explain some of the discrepancies between hypotheses and the geological and archaeological record. (Guballa et al.)
Using available data — provided down through the years by, among other things, fieldwork, close observations of large and small eruptions that have added a wealth of new details since the ground-breaking Pinatubo era, along with up-to-date knowledge about Earth systems (Marshall et al.) — Black et al. crunched numbers for the Youngest Toba Tuff through CESM 1.3, a three-dimensional climate model that takes into account interactions among the atmosphere, Earth’s oceans, and its sea ice.
The team ran multiple simulations and tried to account for as many variables as possible.
They didn’t get into ozone depletion — perhaps because it’s still a new field of research.
Seasons were too much, but they could and did include factors like El Niño and what seemed to them to be the most reasonable range of Toba’s estimated sulfur emission — from roughly 10x Pinatubo (200 megatonnes) to ~100x Pinatubo (2,000 megatonnes).
The main and coignimbrite plume height they used for this model of the supereruption was 30-40 km (19-25 miles) — for comparison, Hunga Tonga’s calculated plume height on January 15, 2022, maxed out at 58 km (36 miles).
In brief — and blithely ignoring error bars, which are very important for Toba (as we’ll see next time) but this is just a general lay post — here’s what Black et al found in their Toba model:
- In all runs, peak visibility and temperature effects occurred six to thirty months after the eruption.
- Effects on daylight: This is technically “aerosol optical depth” (AOD), and the model runs by Black et al. showed a maximum value of AOD 1-2 for the 200 megatonne (MT) sulfur dioxide Toba emission. That’s the equivalent of a very polluted or dusty day, with the Sun almost totally hidden and extremely poor visibility.
I couldn’t find anything online for AOD 8-10 — the value obtained in the model’s 2,000 MT release. There apparently are no modern equivalents.
Perhaps the descriptions from other researchers of the immediate post-Toba period being just slightly brighter than a full moon are close.
However, I’m not sure that it’s global for six to thirty months. Those AOD values are “maximum monthly zonal mean values” and, in practical terms, might not apply to all regions of the planet all the time.
It would certainly hit us humans and our global civilization hard, though.
- For 200 to 2,000 MT of SO2, global mean surface temperatures dropped roughly 2-4° F (>1 to 2° C) or more for at least five years. With the 2,000 MT release, temperatures did not recover to pre-Toba levels during a ten-year run cycle; Black et al. noted a possible explanation for this might be the longer time it takes ocean heat content to recover. (Spoiler: Cooler ocean temperatures mean less seawater evaporation and a resulting slow-down of the water cycle.)
- There was significant regional variation in temperature effects. For a 200 MT sulfur dioxide eruption, Northern Hemisphere temperatures dropped as much as 7-9° F (4-5° C), while the Southern Hemisphere effects were much milder.
For 2,000 MT, regional cooling was more than 14-18° F (8-10° C) in interior North America. Again, the Southern Hemisphere (where our ancestors were evolving in Africa) got off easy.
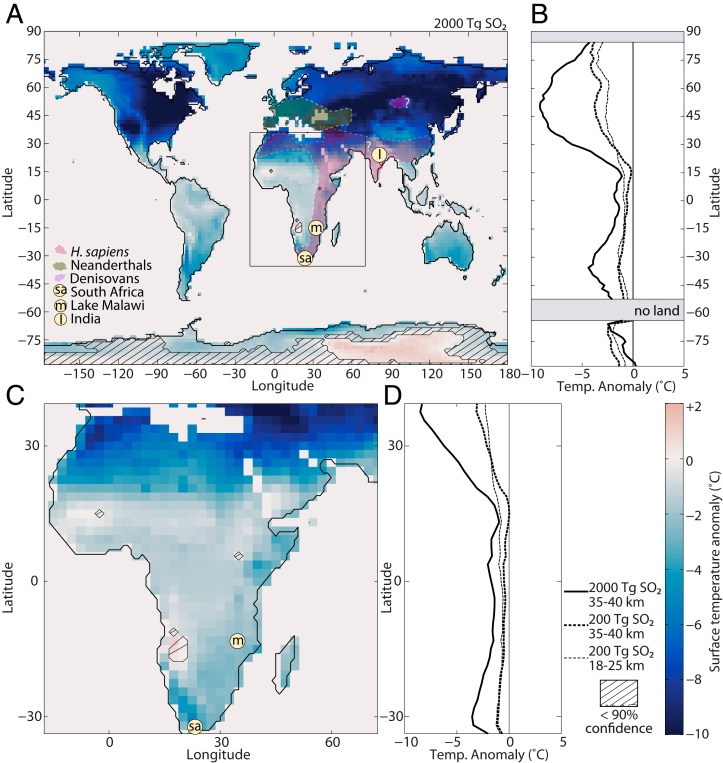
Black et al., Figure 3, 2,000 megatonne SO2 emission, second year; PNAS license
- In terms of precipitation, the modeling didn’t show any changes outside normal climate variation for the 200 MT sulfur dioxide release.
For 2,000 megatonnes, though, there was a drop in precipitation. Even five years after eruption, models still showed it below the range of typical variation.

Black et al., Figure 4, PNAS license


This study solved the riddle of why H. sapiens near Olduvai Gorge and Lake Mentawi apparently (per lake core samples) did not have to deal with the dire consequences hypothesized for the Youngest Toba Tuff supereruption by many experts.
For us today, if the model is even close to correct, forewarned is meaningless.
A supereruption like that would reboot human civilization. Our distant descendants would end up wondering how all these pieces of plastic, Gorilla Glass, and copper got into the geologic record!
But that’s a big “if,” dependent on the assumptions that Black et al. made and on other things, too.
Volcanologists sometimes can estimate sulfur content in prehistoric eruptions by drilling ice cores in Greenland or Antarctica.
That seems a little roundabout — and it is — but it’s also very clever.
Sulfate aerosols in the stratosphere sometimes do get into polar air circulation and eventually precipitate out onto snow flakes that soon become part of the polar ice cap.
As just one example, there’s a Pinatubo layer up there.
Boffins have developed ways to measure these ice-core sulfur layers, date them, and sometimes even identify the volcano they came from.
Of course, the only positive ID comes from ash particles, if any are present, that are identical to what the volcano (or supervolcano) erupted.
A New Zealand supereruption left ash in Antarctica, but no Toba ash has been found yet at either pole, unfortunately. (Costa et al.)
There is a very large sulfur layer from around the time of Toba, but at this level of science, “around” isn’t good enough.
Experts need to have a precise date — with multiple decimal-point digit accuracy — for the Youngest Toba Tuff in order to be sure that this sulfur layer is the right one. (Crick et al.; Scaillet and Oppenheimer)
If it is, then yay! Computer models can use that value for much more reliable simulations.
But there’s a complication.
At least four separate sulfur levels in ice cores span the Toba time’s + or – error interval. (Caron et al.; Costa et al.; Lin et al.)
This raises some interesting questions.
Can supereruptions happen episodically? ( Brown et al.; Caron et al.)
Are there other big eruptions around that time that we might have overlooked?
Or supereruptions — is it possible that more than one supereruption can occur in a short span of time? (Brown et al.; Mason et al.)
If so, did that double-whammy cause an ice age around 74,000 years ago?
Maybe, but it’s highly debatable.
To check this out, we’ll first need to meet another supervolcano.
It’s in Guatemala and very possibly did contribute one of the ice-core sulfur layers that currently puzzle Toba researchers because its magma, unlike Toba’s, has a very high sulfur content. (Lin et al.; Scaillet and Oppenheimer)
And while the present consensus on its supereruption date puts it outside the Toba error bars, at least one research team does suggest a possible time link to Toba.
See you next time!
Featured image: NASA, public domain.
Sources:
Those in the VEI 8 and first Toba posts plus those specifically mentioned in this one:
- Acocella, V.; Di Lorenzo, R.; Newhall, C.; and Scandone, R. 2015. An overview of recent (1988 to 2014) caldera unrest: Knowledge and perspectives. Reviews of Geophysics, 53(3): 896-955.
- Anil, D.; Devi, M.; Blinkhorn, J.; Smith, V.; and others. 2023. Youngest Toba Tuff deposits in the Gundlakamma River basin, Andhra Pradesh, India and their role in evaluating Late Pleistocene behavioral change in South Asia. Quaternary Research, 115, 134-145.
- Bachmann, O., and Huber, C. 2016. Silicic magma reservoirs in the Earth’s crust. American Mineralogist, 101(11): 2377-2404.
- Black, B. A.; Lamarque, J. F.; Marsh, D. R.; Schmidt, A.; and Bardeen, C. G. 2021. Global climate disruption and regional climate shelters after the Toba supereruption. Proceedings of the National Academy of Sciences, 118(29): e2013046118.
- Brown, S. K.; Crosweller, H. S.; Sparks, R. S. J.; Cottrell, E.; and others. 2014. Characterisation of the Quaternary eruption record: analysis of the Large Magnitude Explosive Volcanic Eruptions (LaMEVE) database. Journal of Applied Volcanology, 3: 1-22.
- Caron, B.; Del Manzo, G.; Villemant, B.; Bartolini, A.; and others 2023. Marine records reveal multiple phases of Toba’s last volcanic activity. Scientific Reports, 13(1): 11575.
- Cashman, K. V., and Sparks, R. S. J. 2013. How volcanoes work: A 25-year perspective. Bulletin, 125(5-6): 664-690.
- Chesner, C. A. 2012. The Toba caldera complex. Quaternary International, 258: 5-18.
- Cohen, A. S.; Campisano, C. J.; Arrowsmith, J. R.; Asrat, A.; and others. 2022. Reconstructing the environmental context of human origins in Eastern Africa through scientific drilling. Annual Review of Earth and Planetary Sciences, 50(1): 451-476.
- Costa, A.; Smith, V. C.; Macedonio, G.; and Matthews, N. E. 2014. The magnitude and impact of the Youngest Toba Tuff super-eruption. Frontiers in Earth Science, 2: 16.
- Crick, L.; Burke, A.; Hutchison, W.; Kohno, M.; and others. 2021. New insights into the ~74 ka Toba eruption from sulfur isotopes of polar ice cores. Climate of the Past Discussions, 2021, 1-28.
- Deligne, N. I.; Coles, S. G.; and Sparks, R. S. J. 2010. Recurrence rates of large explosive volcanic eruptions. Journal of Geophysical Research: Solid Earth, 115(B6).
- Donovan, A., and Oppenheimer, C.
2018. Imagining the unimaginable: communicating extreme volcanic risk. Observing the Volcano World: Volcano Crisis Communication, 149-163. - Gelman, S. E.; Gutiérrez, F. J.; & Bachmann, O. 2013. On the longevity of large upper crustal silicic magma reservoirs. Geology, 41(7): 759-762.
- Giordano, G., and Caricchi, L. 2022. Determining the state of activity of transcrustal magmatic systems and their volcanoes. Annual Review of Earth and Planetary Sciences, 50(1): 231-259.
- Guballa, J. D.; Bollmann, J.; Schmidt, K.; and Lückge, A. 2024. The Toba eruption 74,000 years ago strengthened the Indian winter monsoon‐evidence from coccolithophores. Paleoceanography and Paleoclimatology, 39(4): e2023PA004823.
- Jellinek, A. M., and DePaolo, D. J. 2003. A model for the origin of large silicic magma chambers: precursors of caldera-forming eruptions. Bulletin of Volcanology, 65: 363-381.
- Khaykin, S.; Podglajen, A.; Ploeger, F.; Grooß, J. U.; and others. 2022. Global perturbation of stratospheric water and aerosol burden by Hunga eruption. Communications Earth & Environment, 3(1): 316.
- Lin, J.; Abbott, P. M.; Sigl, M.; Steffensen, J. P.; and others. 2023. Bipolar ice-core records constrain possible dates and global radiative forcing following the∼ 74 ka Toba eruption. Quaternary Science Reviews, 312: 108162.
- Liu, P. P.; Caricchi, L.; Chung, S. L.; Li, X. H.; and others. 2021. Growth and thermal maturation of the Toba magma reservoir. Proceedings of the National Academy of Sciences, 118(45): e2101695118.
- Lowenstern, J. B.; Smith, R. B.; and Hill, D. P. 2006. Monitoring super-volcanoes: geophysical and geochemical signals at Yellowstone and other large caldera systems. Philosophical Transactions of the Royal Society A: Mathematical, Physical and Engineering Sciences, 364(1845): 2055-2072.
- Luo, S. J.; Kim, J. H.; Johnson, W. E.; Van Der Walt, J.; and others. 2004. Phylogeography and genetic ancestry of tigers (Panthera tigris). PLoS Biology, 2(12): e442.
- Marshall, L. R.; Maters, E. C.; Schmidt, A.; Timmreck, C.; and others. 2022. Volcanic effects on climate: recent advances and future avenues. Bulletin of Volcanology, 84(5): 54.
- Mason,B. G., Pyle,D. M., and Oppenheimer, C. 2004. The size and frequency of the largest explosive eruptions on Earth. Bulletin of Volcanology, 66:735–748.
- Mastin, L. G.; Van Eaton, A. R.; and Lowenstern, J. B. 2014. Modeling ash fall distribution from a Yellowstone supereruption. Geochemistry, Geophysics, Geosystems, 15(8): 3459-3475.
- Miller, C. F. and Wark, D. A. 2008. Supervolcanoes and their explosive supereruptions. Elements, 4(1): 11-15.
- Mucek, A. E.; Danišík, M.; de Silva, S. L.; Schmitt, A.K.; and others. 2017. Post-supereruption recovery at Toba Caldera. Nature Communications, 8:15248.
- Oppenheimer, C. 2011. Eruptions That Shook the World. Cambridge: Cambridge University Press. Retrieved from https://play.google.com/store/books/details?id=qW1UNwhuhnUC
- Pyle, D. M. 2018. What can we learn from records of past eruptions to better prepare for the future?. Observing the Volcano World: Volcano Crisis Communication, 445-462.
- Rampino, M. R., and Ambrose, S. H. 2000. Volcanic winter in the Garden of Eden: The Toba supereruption and the late Pleistocene human population crash, in McCoy, F. W., and Heiken, G., eds., Volcanic Hazards and Disasters in Human Antiquity: Boulder, Colorado, Geological Society of America Special Paper 345.
- Salisbury, M. J.; Jicha, B. R.; de Silva, S. L.; Singer, B. S.; and others. 2011. 40Ar/39Ar chronostratigraphy of Altiplano-Puna volcanic complex ignimbrites reveals the development of a major magmatic province. Bulletin, 123(5-6), 821-840.
- Scaillet, B., and Oppenheimer, C. 2024. On the budget and atmospheric fate of sulfur emissions from large volcanic eruptions. Geophysical Research Letters, 51: e2023GL107180
- Schaller, N.; Griesser, T.; Fischer, A.; Stickler, A.; and Onnimann, S. 2009. Climate effects of the 1883 Krakatoa eruption: Historical and present perspectives. Vjschr. Natf. Ges. Zürich, 154: 31-40.
- Self, S. 2006. The effects and consequences of very large explosive volcanic eruptions. Philosophical Transactions of the Royal Society A: Mathematical, Physical and Engineering Sciences, 364(1845): 2073-2097.
- Sulpizio, R.; Dellino, P.; Doronzo, D. M.; and Sarocchi, D. 2014. Pyroclastic density currents: state of the art and perspectives. Journal of Volcanology and Geothermal Research, 283: 36-65.
- Sun, Q.; Lu, T.; Li, D.; and Xu, J. 2024. The Impact of the Hunga Tonga–Hunga Ha’apai Volcanic Eruption on the Stratospheric Environment. Atmosphere, 15(4): 483.
- Szymanowski, D.; Forni, F.; Phua, M.; Jicha, B.; and others. 2023. A shifty Toba magma reservoir: Improved eruption chronology and petrochronological evidence for lateral growth of a giant magma body. Earth and Planetary Science Letters, 622: 118408.
- Taha, G.; Loughman, R.; Colarco, P. R.; Zhu, T.; and others. 2022. Tracking the 2022 Hunga Tonga‐Hunga Ha’apai aerosol cloud in the upper and middle stratosphere using space‐based observations. Geophysical Research Letters, 49(19): e2022GL100091.
- Williams, M. 2012. The ~73 ka Toba super-eruption and its impact: History of a debate. Quaternary International, 258: 19-29.
- Wilson, C. J.; Cooper, G. F.; Chamberlain, K. J.; Barker, S. J.; and others. 2021. No single model for supersized eruptions and their magma bodies. Nature Reviews Earth & Environment, 2(9): 610-627.
